09. A*: Visualization
A*: Visualization
Path Planning
So far, you’ve generated the shortest path using the A* algorithm, but it was really hard to see it. Now, you'll edit the visualization function that you previously coded and modify it to plot the shortest path.
Udacity Workspace
For this quiz, you'll use the Udacity Workspace . Move to the next concept, enable the GPU, Go to Desktop, and follow these instructions. Remember to disable the GPU once you are done generating the image.
Instruction
Clone the Lab from GitHub
$ cd /home/workspace/
$ git clone https://github.com/udacity/RoboND-A-Visualization
Next, edit
main.cpp
Modify the
visualization
function and plot the start position, goal position, and path using the
matplotlib
python library.
Note that you are required to use letter 'o' (not number character '0') and the asterisk '*' to mark the start and end states in visualization!
void visualization(Map map, Planner planner)
{
    //Graph Format
    plt::title("Path");
    plt::xlim(0, map.mapHeight);
    plt::ylim(0, map.mapWidth);

    // Draw every grid of the map:
    for (double x = 0; x < map.mapHeight; x++) {
        cout << "Remaining Rows= " << map.mapHeight - x << endl;
        for (double y = 0; y < map.mapWidth; y++) {
            if (map.map[x][y] == 0) { //Green unkown state
                plt::plot({ x }, { y }, "g.");
            }
            else if (map.map[x][y] > 0) { //Black occupied state
                plt::plot({ x }, { y }, "k.");
            }
            else { //Red free state
                plt::plot({ x }, { y }, "r.");
            }
        }
    }

    // TODO: Plot start and end states in blue colors using o and * respectively

    // TODO: Plot the robot path in blue color using a .

    //Save the image and close the plot
    plt::save("./Images/Path.png");
    plt::clf();
}
Here are some helpful commands you can use to generate plots with the
matplotlib
library:
-
Set Title
:
plt::title("Your Title"); -
Set Limits
:
plt::xlim(x-axis lower limit, x-axis upper limit ); -
Plot Data
:
plt::plot({ x-value }, { y-value }, "Color and Shape"); -
Save Plot
:
plt::save("File name and directory"); -
Close Plot
:
plt::clf();
Check out this
link
for more information on the
matplotlib
C++ library. For information regarding the plot color and shape refer to the LineSpec and LineColor section of the
MATLAB
documentation.
Then, compile the program
$ cd RoboND-A-Visualization/
$ rm -rf Images/*    #Delete the folder content and not the folder itself!
$ g++ main.cpp -o app -std=c++11 -I/usr/include/python2.7 -lpython2.7
Finally, run the program
$ ./app
If you get a warning regarding the
matplotlib
library, just ignore it.
Now, wait for the program to generate the path and store it in the
/home/workspace/RoboND-A-Visualization/Images
directory!
Generated Path
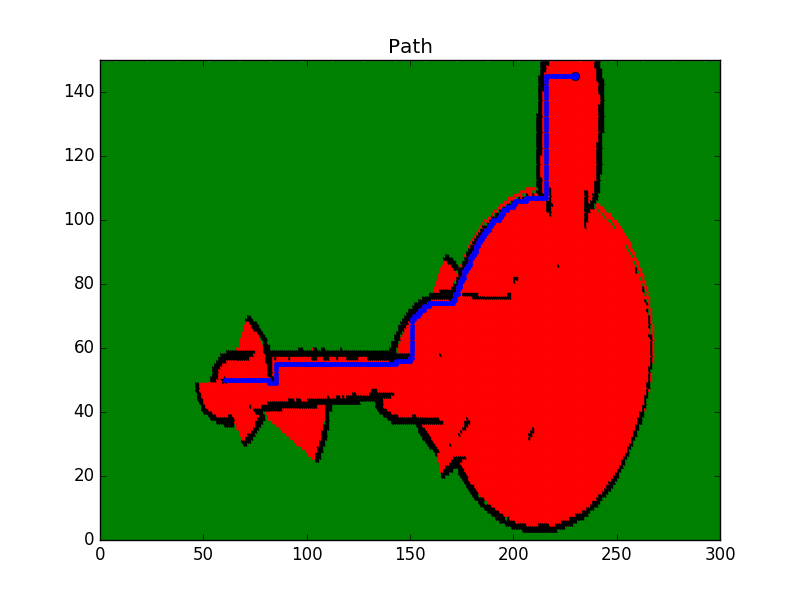
Map Legend
- Green: Unkown/Undiscovered zone
- Red: Free zone
- Black: Occupied zone
- Blue: Shortest Path